The ACT-Accelerator Global COVID-19 Access Tracker (GCAT) is a dynamic tool to transparently track progress on access to COVID-19 vaccines, treatments, tests, and PPE.
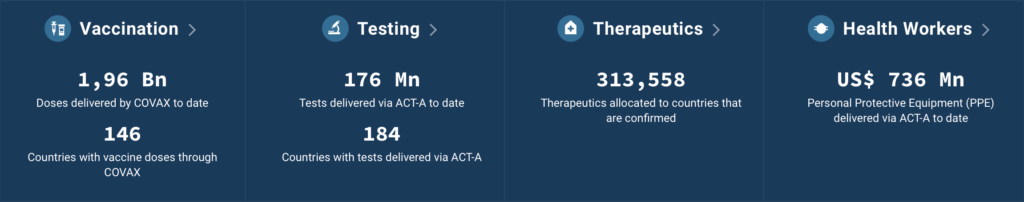
Vaccination
It is crucial to prioritize the vaccinating highest-risk groups (healthcare workers and the elderly), as well as pregnant and immunocompromised people to prevent severe disease and death. COVAX – the ACT-Accelerator’s Vaccines Pillar – is co-led by the Coalition for Epidemic Preparedness Innovations (CEPI), Gavi, the Vaccine Alliance, the World Health Organization (WHO) and UNICEF.
Testing
Testing is needed to identify disease hotspots and track the emergence of new, dangerous variants. The ACT-A Diagnostics Pillar is co-convened by FIND and the Global Fund, with strong support from WHO, working closely with over 50 global health partners to scale-up equitable access to COVID-19 diagnostic technologies and tools.
Therapeutics
Treatments, including medical oxygen, are needed for those severely affected by COVID-19 or to prevent those in at-risk groups from progressing to severe disease. The Therapeutics Pillar, co-led by Wellcome, the Global Fund and Unitaid, actively tracks the pipeline for new therapeutic products, engaging originator and generic companies on access issues.
Protection of Health Workers
The target is to ensure that health and community care workers have the necessary personal protective equipment and training to apply appropriate infection prevention and control practices.
More data
Partners
The Access to COVID-19 Tools (ACT) Accelerator is a groundbreaking global collaboration to accelerate development, production, and equitable access to COVID-19 tests, treatments, and vaccines.
Launched at the beginning of the pandemic, the ACT-Accelerator partnership brings together governments, scientists, businesses, civil society, philanthropists, global health and finance organizations. The ACT-Accelerator agencies are the Bill & Melinda Gates Foundation, CEPI, FIND, Gavi, The Global Fund, UNICEF, Unitaid, Wellcome, WHO, and the World Bank.
These organizations have joined forces to speed up an end to the pandemic by supporting the development of, and equitable distribution to, the tests, treatments and vaccines the world needs to reduce mortality and severe disease, restoring full societal and economic activity globally in the near term, and facilitating high-level control of COVID-19 disease in the medium term.
Disclaimer: The ACT-A and MLT accept no responsibility whatsoever for any inaccurate or incomplete information or data that may be included in this database, and expressly disclaims any liability for damages as a result of its use. The responsibility for the interpretation and use of the content lies with the user. The ACT-A and MLT assume no responsibility or liability for any consequence resulting directly or indirectly from any action or inaction users take based on or made in reliance on the information and data available in this database.
The designations employed and the presentation of the material do not imply the expression of any opinion whatsoever on the part of the institutions concerning the legal status of any country, territory, city or area or of its authorities, or concerning the delimitation of its frontiers or boundaries. Dotted and dashed lines on maps represent approximate border lines for which there may not yet be full agreement.
Any mention of countries refers to countries, territories, and areas. A total of 234 countries, territories, and areas are included in the Global COVID-19 Access Tracker.